On-Target-Off-Tumor toxicity is a major concern in precision oncology and immuno-oncology because it means that even a highly specific therapy can harm the patient if the target antigen isn't exclusive to the tumour. Researchers aim to minimise this risk by identifying tumour-specific antigens or engineering therapies that require multiple conditions to activate, increasing safety while maintaining effectiveness. However, the story is not always that simple.

Dr Vivek Senthivel
Senior Scientist

 Insights
|
December 16, 2025
|
9 min read
Regulation of gene expression is a fundamental characteristic of all living cells. It is needed for spatiotemporal control of cellular functions in response to varying environmental conditions. Defects in regulation can lead to disease conditions like cancer, resulting in altered gene expression profile. These differences are exploited in designing therapeutics where cancer-specific biomarker genes are targeted. However, in most cases the difference between healthy and cancerous cells is not very clear and can result in toxicity for healthy cells.
One of the main reasons for this issue is the presence of low levels of cancer-specific antigens in healthy cells. This leads to the therapeutic designed to target cancer-specific antigen binding to both healthy and cancerous cells, resulting in On-Target-Off-Tumor (OTOT) toxicity. Overcoming on-target, off-tumour toxicity has long been one of the most significant considerations of various cancer therapies, like CAR T-cell therapies or other targeted Immunotherapeutics for solid tumours. To avoid serious side effects and complications, assessing the safety and efficacy of therapeutics as early as possible in the drug development process is crucial.
An important step in designing drugs that target cells primarily based on the density of antigen receptors present on their surface is to have an in vitro cell substrate platform that model cancer cells with varying amounts of target antigen densities. This platform can be used to both screen for candidate drugs that would bind “cancer-specific” antigens and to evaluate effector response of the drugs as a function of target antigen density.
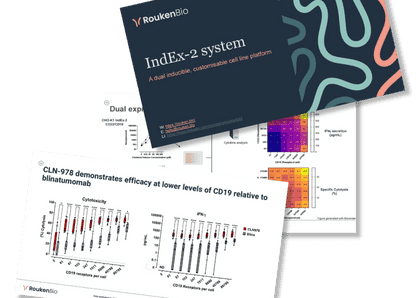
To address this challenge, at RoukenBio we developed IndEx-2, an in vitro cell-based platform which allows the expression of one or two target antigen of interest (TAOIs) over a range of biologically relevant levels using extracellular stimulus. It was developed to determine precise antigen density activation thresholds of targeted candidate Immunotherapeutics early in the drug development process.
To evaluate the performance of an inducible system like IndEx2 it is useful to represent the gene expression profile using an empirical model like the Hill-function (Figure.1), that has a sigmoidal shape characteristic of most biological dose-response functions, provided steady-state response is achieved for various doses of stimulus within a relevant period. For a given range of input (stimulus), Hill-function produces a corresponding output (response) that is shaped by four parameters. For gene expression response, they can be defined as basal expression (B), maximal expression (M), stimulus needed for half-maximal response (K) and the steepness of the response at half-maximal response denoted by the Hill-coefficient (n). Apart from being used as performance metrics to evaluate the efficiency of an inducible gene expression system, these parameters can guide the design principles for engineering an efficient system.
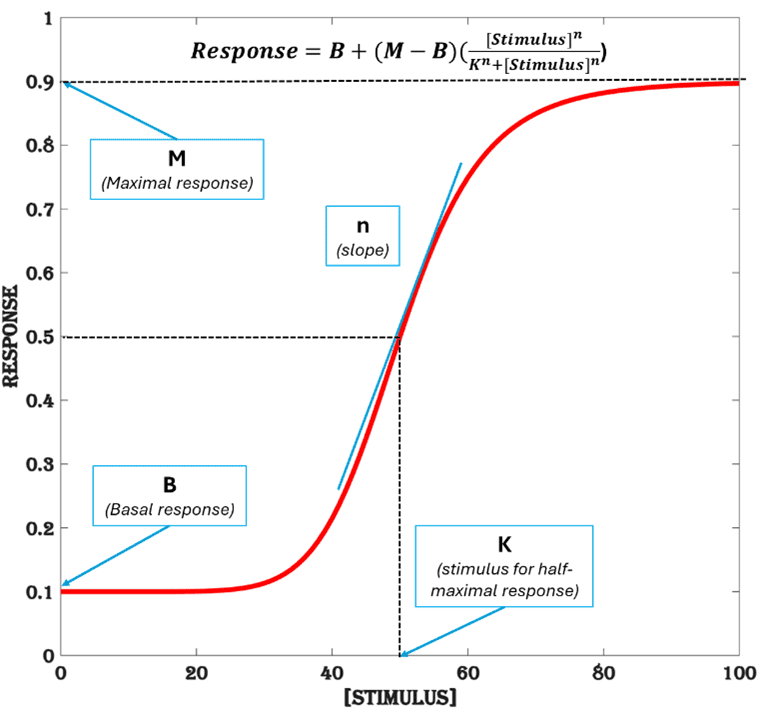
Figure 1. Hill-function. An empirical model with four parameters (K, n, B, M) to represent a dose-response function.
To build a transcription-controlled gene expression in a cell, an ideal inducible system should be assessed based on the following performance metrics:
The range of stimulus that results in a dose-dependent increase in response is called the dynamic range of a dose-response profile. On the vertical axis it is limited by the basal and maximal response and on the horizontal axis by the lowest stimulus that generates a significant response and the stimulus beyond which there is no significant change in response (light blue area in Figure.2). In a conservative view, the dynamic range is strictly considered as the linear part of the response curve, limited by 10% and 90% of maximal response in the y-axis and in the x-axis by the lowest stimulus that produces 10% and 90% of maximal response (dark blue area in Figure.2).
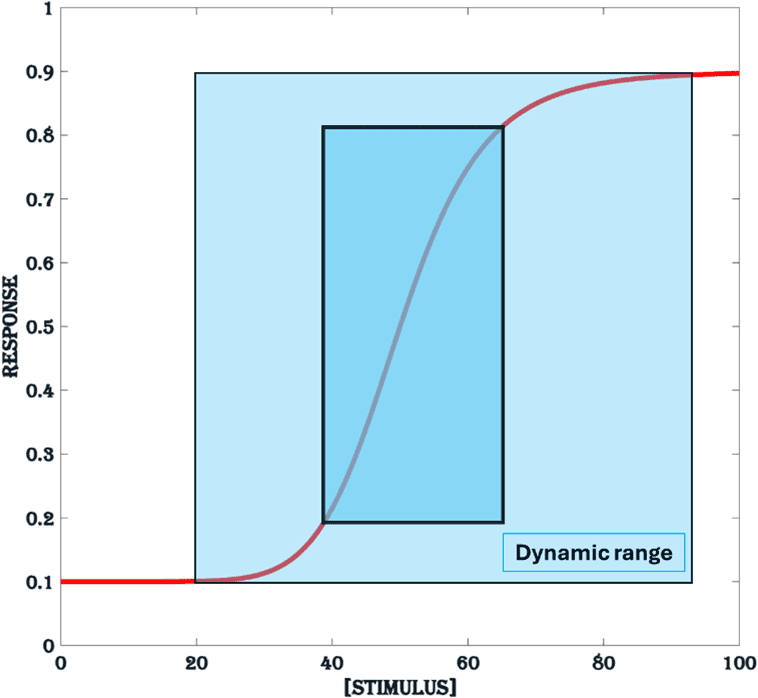
Figure 2. Dynamic range. The blue area represents the dynamic range of the stimulus, defined as the range for which there is a significant change in response. The dark blue area represents the conservative dynamic range.
The most important requirement for an inducible system is a dose-dependent increase in gene expression with increasing concentration of the respective inducers (for ex. chemical inducers used as stimulus). This is to make sure that the desired output (antigen density) is achieved reliably by induction using a given amount of stimulus. With a smaller dynamic range (steeper curve), it is difficult to control the response output by varying the concentrations of the inducer (stimulus), as even the slightest difference in input due to unavoidable experimental variability (like pipetting error, etc.) can result in a significant change in the output. Whereas, with a large dynamic range it is possible to obtain a consistent and titratable response. It is worth noting here that the above discussed dynamic range of the inducible system (the IndEx2 cell) to respond to a range of stimulus can be identified only if the dynamic range of the instruments used for detecting the output is itself larger and encompasses the dynamic range of the inducible
cell. The dynamic range of an inducible system is dictated by the following parameters: sensitivity (K, stimulus for half-maximal response), responsivity (n, Hill-coefficient) and fold change (M/B, the ratio of maximal to basal response).
The effective concentration EC50 of the stimulus that produces 50% of maximal response is commonly referred to as the sensitivity (K) of an inducible system. It is a function of both the limit-of-detection (lowest concentration of the stimulus that produces a significantly higher gene expression level compared to the basal level) and the maximum gene expression level obtained by the system. This parameter is a scaling factor that expands and shifts the dynamic range from left to right in the horizontal axis (Figure.3). Inducible systems with low K values are very sensitive (responds to very low concentration of the stimulus) and tend to be saturated by low amounts of stimulus. For higher K values, the inducible system displays a thresholded response (a large stimulus needed for a significant response) and a gradual slope, reaching maximal response only for very high concentration of the stimulus, resulting in a large dynamic range.
The sensitivity of an inducible system is usually impacted by the binding affinities of the system components that set the detection limit and the number of components in the signaling cascade that allows concentration-dependent thresholded response. In general, higher binding affinities and fewer system components lead to high sensitivity (low K and small dynamic range) in a signaling cascade. Therefore, to achieve a large dynamic range it is useful to engineer a system with multiple components with weaker binding affinities. There are few strategies to reduce sensitivity (high K value) and increase thresholding:
1) use of split proteins with low binding affinity
2) multi-component activation system
3) Decoy promoters to quench the transcription factors.
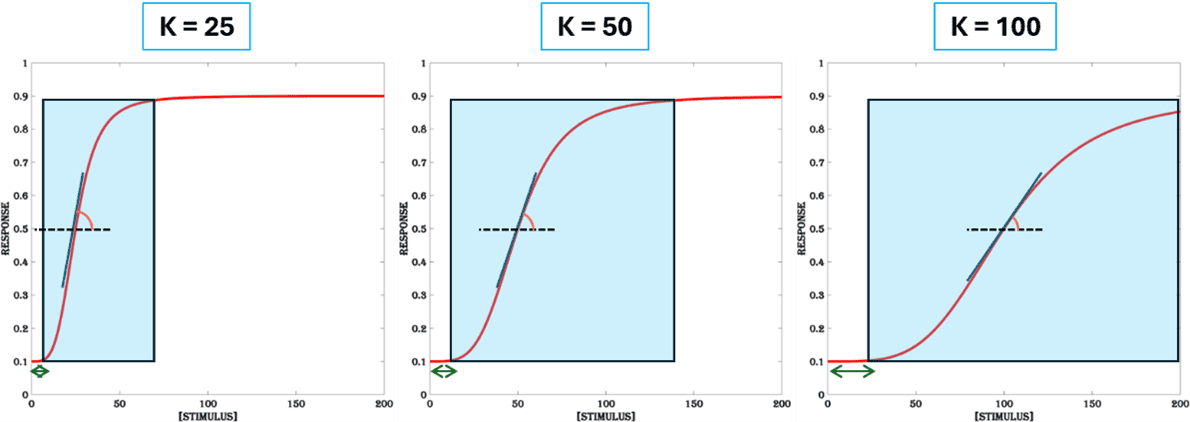
Figure 3. Sensitivity. The dynamic range of the system increases with less sensitivity (higher values of K). It increases thresholding (the length of the green double arrow) and lowers steepness (the inner angle between vertical blue line and the horizontal dashed black line) of the dose-response curve. All other parameters are set at (n =4, B =0.1 & M = 0.9).
The degree of change in the response of a system for a given increase in the dose of the stimulus is given by the slope of the dose-response function. It is a function of the parameter called Hill-coefficient (n). The steeper the response, the smaller the dynamic range (Figure.4). For a large dynamic range, it is desirable to have gradual increase in gene expression output for increasing doses of the stimulus. Cooperative binding, positive feedback and sequential activation of components are known biological mechanisms that results in high responsivity (higher value of n).
Though sensitivity (K) is a parameter assigned for measuring the extent of thresholding in a dose-response curve and responsivity (n) for steepness, changing any one parameter affects both thresholding and steepness. For high sensitivity (low K values), thresholding is less but steepness is high, whereas for high responsivity (high n values), both thresholding and steepness are high. As a result, engineering strategies that modulate thresholding can affect sensitivity and responsivity differently and thereby the dynamic range is decided by a tug between the two. For a large dynamic range it is best to regulate the steepness of the dose-response curve, as both sensitivity and responsivity must be lowered to obtain a gradient response curve. From a design perspective, same strategies can be used to reduce sensitivity and responsivity of an inducible system.
[Note: In the context of inducible gene expression the term “sensitivity” is commonly attributed to both the parameters (‘K’ and ‘n’). For example, a system with high ‘n’, is called ultrasensitive. However, for disambiguation the author has attributed the term “sensitivity” solely to the parameter ‘K’ and introduced a new term “responsivity” for ‘n’].
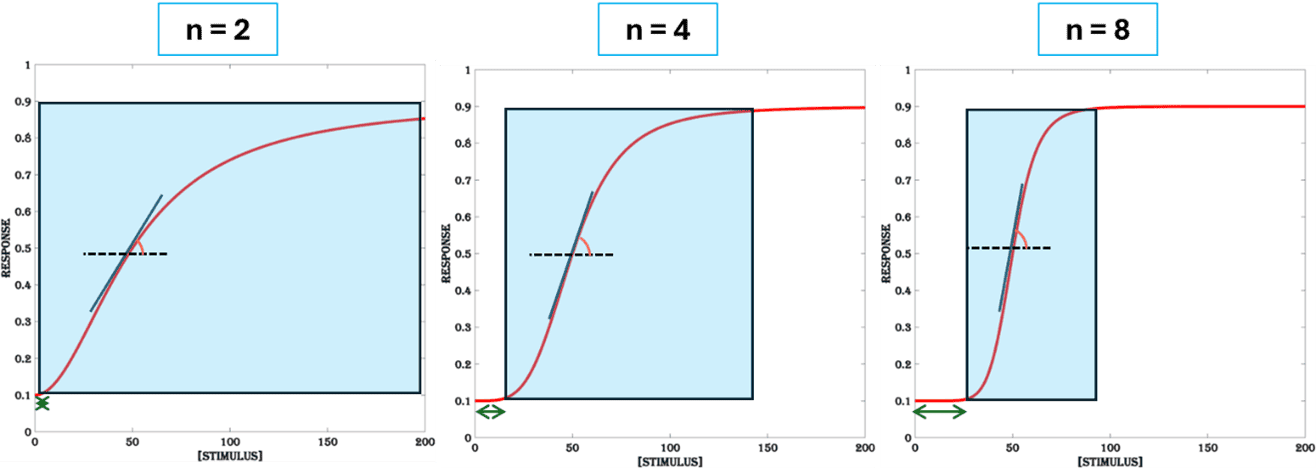
Figure 4. Responsivity. The dynamic range of the system decreases with high responsivity (higher values of n). An increase in steepness (the inner angle between vertical blue line and the horizontal dashed black line) and thresholding (the length of the green double arrow) is a result of high responsivity. All other parameters are set at (K = 50, B =0.1 & M = 0.9).
In the case of inducible gene expression fold-change is defined as the ratio of maximal to basal gene expression level. It sets the limit of the dynamic range on the y-axis and is a function of basal and maximal expression.
The level of gene expression observed when an inducible system is exposed to no stimulus or sub-responsive (sometimes denoted by 10% of maximal response) concentration of stimulus is called basal expression or leaky expression, as it cannot be controlled by varying the strength of stimulus (Figure.1). The main contributors of leaky gene expression in a living cell are:
1) Spontaneous activation of the transcription factors in the absence of the inducer (e.g. due to high-affinity between dimers in the case of dimerization-dependent activation).
2) Transient binding of the transcription factors to a strong gene promoter and low-level transcription.
3) “Bystander activation” of the inducible gene cassette from a proximal transcription bubble or a highly active upstream gene.
To have a tightly controlled inducible system and a large dynamic range, it is necessary to have low basal expression (Figure.5a). There are different design strategies to reduce basal expression:
1) Conditional localisation of transcription factors into the nucleus using phosphorylation dependent transport.
2) Transcription attenuation, where expression of repressor proteins that binds the promoters only in the absence of an inducer and sterically prevents transcription factor binding.
3) Insulator DNA sequences that flank the inducible gene expression cassette to prevent genomic context-dependent spontaneous activation.
4) Increasing the degradation rates of the mRNA and protein by modifying the 3’UTR and adding degron signals to the C-terminal, respectively.
5) A cascade gene activation circuit with “incoherent feedforward” or “mutual inhibition”.
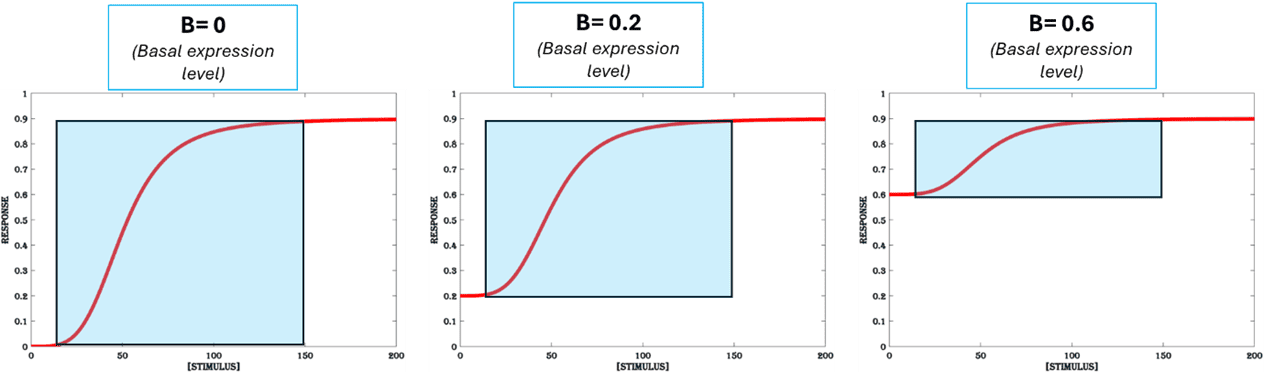
Figure 5a. Basal expression. The response output of an inducible system for no stimulus or sub-responsive concentration of the stimulus. All other parameters are set at (K=50, n =4 & M = 0.9).
The maximum gene expression that can be achieved with a system is called the maximal expression and it sets an upper limit for the concentration of the inducer that is useful in inducing gene expression. A higher maximal expression results in a high fold change and a large dynamic range (Figure.5b). The maximal gene expression is determined by various factors like the amount of transcription and translation machinery available per cell, the rates of protein (the transcription factors and target antigen) production and degradation, the volume of the cell and rate of cell division.
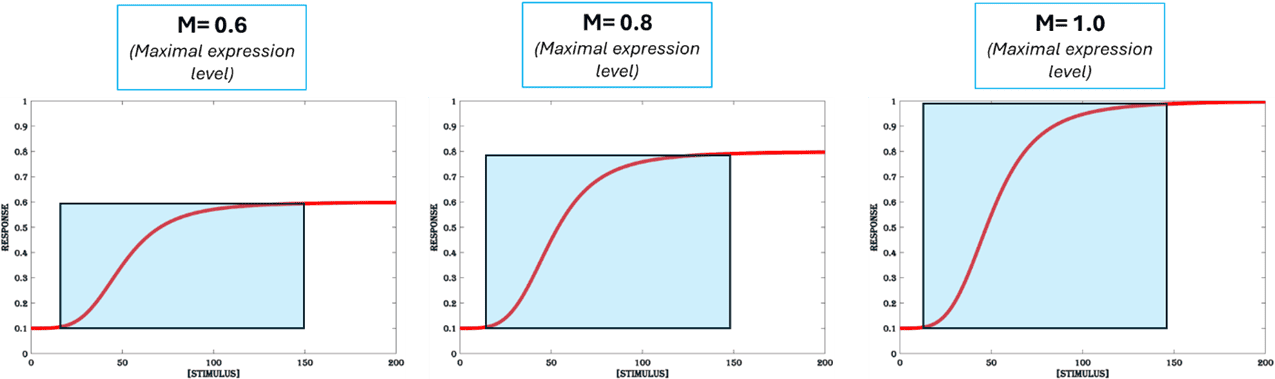
Figure 5b. Maximal expression. The maximum response output achievable for an inducible system for a given range of stimulus is called maximal expression. All other parameters are set at (K=50, n =4 & B = 0.1).
Together all three factors (sensitivity, responsivity and fold-change) determine the dynamic range of the inducible system, and a combination of design features can be used to engineer an inducible system with large dynamic range.
The response (ex. induction of gene expression) of a population of cells to a given amount of stimulus (ex. chemical inducer) is typically a unimodal distribution of gene expression level. The ratio of the mean of the distribution to its standard deviation is described as the signal-to-noise ratio (Figure.6) and is a useful metric to assess the quality of the inducible system. Statistically, signal-to-noise ratio can be thought of as the inverse of the coefficient-of-variation (standard deviation / mean) of the distribution and the quality of the inducible system as the test of significance used to distinguish two overlapping distributions.
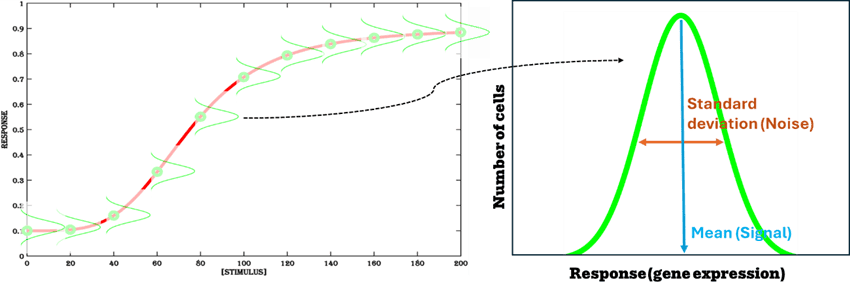
Figure 6. Gene expression distribution in a population of cells. Each data point in a dose response curve is the mean of a distribution of gene expression obtained from a population of cells containing the inducible system.
For the same standard deviation, the signal-to-noise ratio increases with an increase in response, as shown in distribution ‘B’ in (Figure.7), compared to distribution ‘A’.
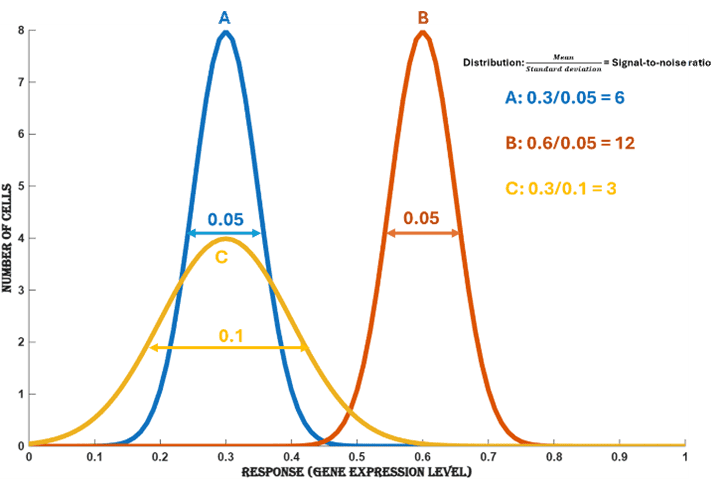
Figure 7. Change in signal-to-noise ratio for varying mean and standard deviation. Increasing the mean (response A -> B) of a distribution increases the signal-to-noise ratio and increasing standard deviation (A -> C) decreases the signal-to-noise ratio.
Typically, an inducible system with high fold-change (on/off ratio) in gene expression allows higher signal-to-noise ratio, but the primary determinant of signal-to-noise ratio is the standard deviation of the distribution. This is because response obtained from small increases in stimulus may not be significant if the standard deviation is large and an even greater fold-change in gene expression is required to achieve the same signal-to-noise ratio. As shown by two inducible systems with same fold-induction but different standard deviations in the distribution of gene expression in a population of cells, (Figure.8) the induction is considered statistically significant only for the system with higher signal-to noise ratio.
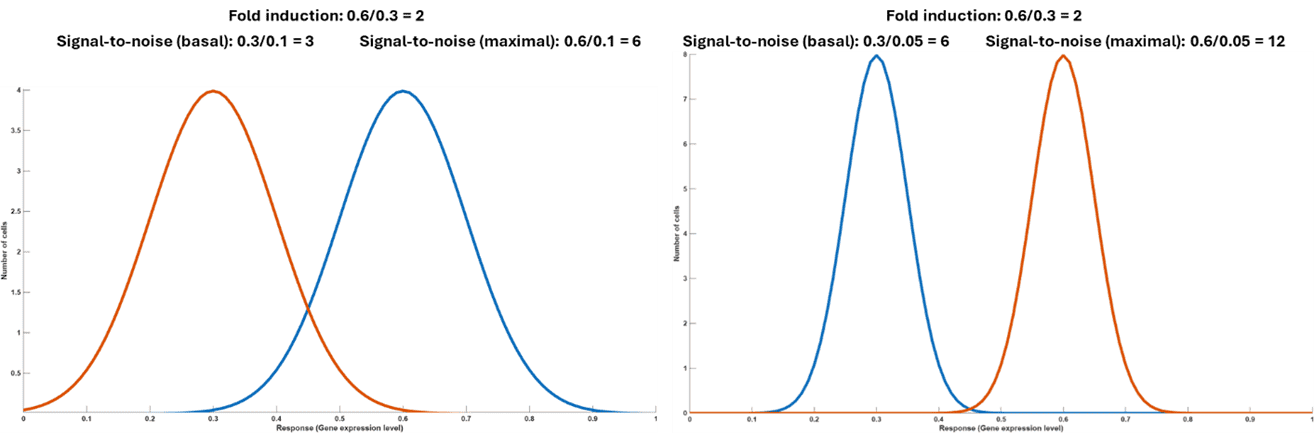
Figure 8. Statistical significance of fold induction for different signal-to-noise ratio. For the same level of fold induction, the two distributions on the right are more statistically different compared to the one on the left, that has a bit of overlap due to large variation in gene expression in the population.
There are many factors that contribute to the variation in distribution of the response-output:
Variation in gene expression in a population of cells is therefore a bottleneck in engineering robust inducible systems. Isolation and expansion of single cells is a common strategy to reduce this variation. RoukenBio’s LocIn system is designed to reduce gene expression variation in a population by accelerating the process of creating isogenic transgenic cell lines. However, due to the stochastic nature of gene expression, even in a clonal population of inducible system, there will be variability in gene expression across cells. Variability in gene expression of a population of isogenic cells is mainly due to molecular noise in the biological system. There are multiple layers of biological mechanism that contributes to molecular noise at cellular level but gets averaged out at population level:
1) The difference in the number of molecules of the inducer (stimulus) encountered by each cell
2) the variation in the number of transcription factors between cells
3) the chance encounter of inducer with the transcription factor, which is a function of their concentration (law of mass action)
4) the probability of activated transcription factor to localise inside the nucleus and find the correct promoter sequence from an abundant stretch of DNA molecules.
5) the difference in the number of molecules of the transcription and translation machinery and the availability of metabolic raw materials
6) the variation in the post-transcriptional and post-translational machinery
7) the difference in rate of mRNA and protein localisation inside the cell
8) the differences in the number of mRNA and protein degradation machinery.
Since molecular noise is a function of the number of molecules, the spread of the response distribution is different for varying concentrations of the inducer (Figure. 9). The distribution is unimodal for both low and high concentration of the inducer, but a bimodal distribution is observed for intermediate concentrations of the inducer. This is a characteristic feature of a bistable gene activation system, where both ON and OFF states are stable (resilience to perturbation). Due to this stability only a fraction of cells responds optimally to a given stimulus, resulting in a wider spread of the distribution. Living cells have evolved to have bistable gene regulation to filter out noise in stimulus, so that they can respond only in the presence of true stimulus.
Though engineering a negative feedback loop in the regulation of gene expression is known to reduce the noise in gene expression and can be used as a design strategy to achieve higher signal-to-noise ratio in an inducible system, it applies only to low and high concentrations of the inducer, where the ON and OFF states are distinct. For intermediate inducer concentrations the same feature (negative feedback loops) creates bimodal distribution. The presence of bimodal distribution with a large spread, reduces the signal-to-noise ratio drastically and makes it difficult to express reliable target antigen levels for intermediate concentrations of the inducer.
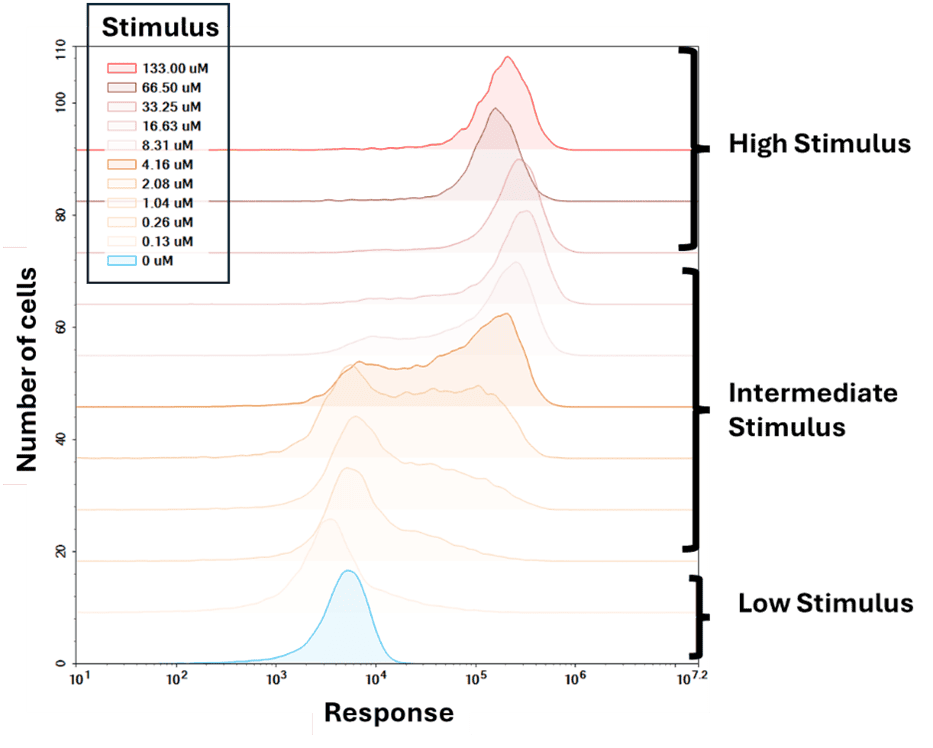
Figure 9. Response distribution for varying stimulus. The distribution of the response is unimodal for low and high concentration of the inducer. For intermediate concentration of the inducer the system displays bimodal distribution that shifts from OFF to ON state, with an increase in inducer concentration.
Along with molecular noise there are other causes for variability in gene expression:
Gene expression is a dynamic behavior that changes over time as a function of both the stimulus stability (half-life) and abundance of gene expression machinery (rate of transcription and translation initiation, mRNA and protein degradation). The dose-response of an inducible system changes non-linearly over time after the addition of an inducer, till it reaches a steady state, where the rate of production of the target antigen balances out the rate of its degradation. Therefore, to obtain a dose-response profile for varying stimulus, it is ideal to take the response value that does not change over time for a given stimulus, otherwise called as the steady-state (Figure 10).
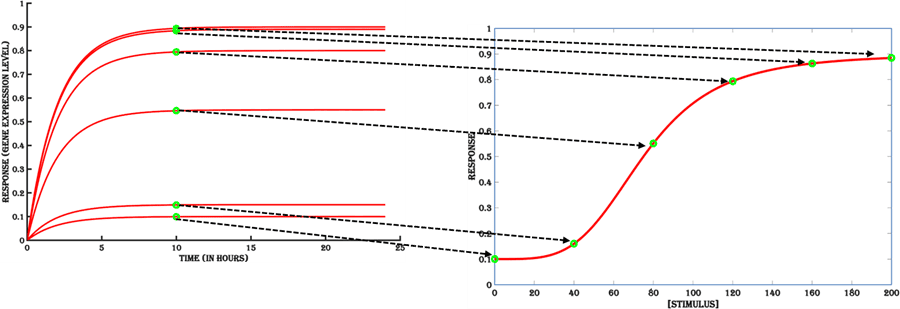
Figure 10. The steady state values (green dots) of the gene expression kinetics are taken to plot the dose-response curve.
The rate at which an inducible system reaches steady state is called switch-On rate (Blue area in Figure 11a). Apart from the molecular machinery involved in gene regulation, transcription, translation and degradation of the target mRNA and protein, promoter strength of the inducible gene, ribosome binding sequence and codons present in the coding region of the target protein are key determinants of the switch-On rate of an inducible system. A faster kinetic ensures that the assay period needed for establishing target antigen expression is shorter and thereby more cost effective, allowing more efficient downstream application of an inducible system.
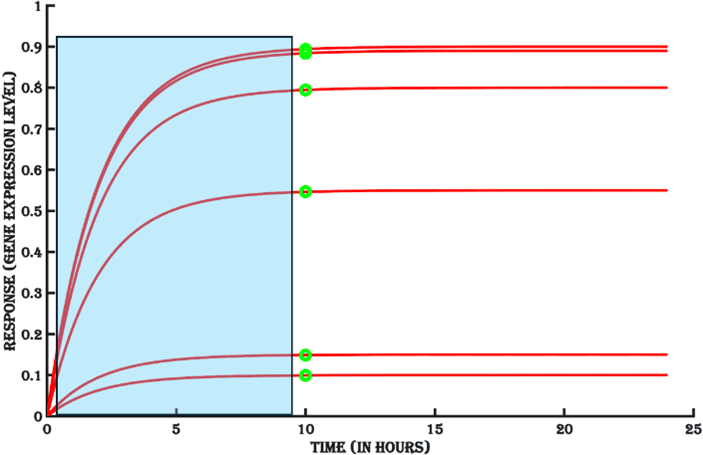
Figure 11a. The kinetics of turning ON of the gene expression.
The period for which the response stays at steady state in the presence of stimulus is the sustained activation stability of the inducible system (Green area in Figure 11b). The availability of sufficient inducer molecules determines the length of the steady state. Sustained activation is important for setting up assays using an inducible target antigen expression system and to obtain meaningful assay response for test samples where the level of target antigen does not change drastically within the assay window. Based on the duration of steady state, it might be necessary to add fresh amounts of the inducer to the system to prolong the assay window.
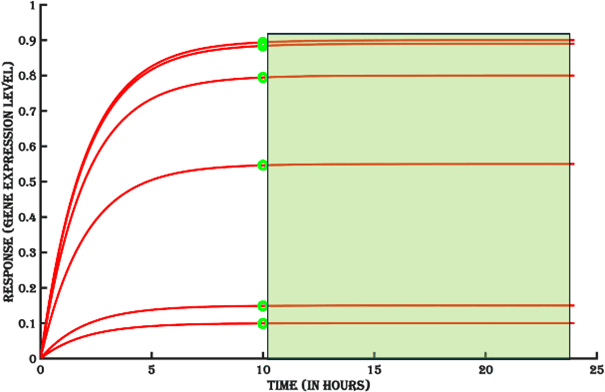
Figure 11b. The stability of sustained gene expression.
A truly responsive inducible system is active only in the presence of stimulus and the extent of response is proportionate to the strength of stimulus. Therefore, on removal of the stimulus the response should return to its basal expression level (response in the absence of the stimulus) (Orange area in Figure 11c). Return of gene expression to its basal levels in the absence of the inducer shows the system is under user control and not just for turning it ON. In the absence of the stimulus, there is no gene activation and kinetics is dominated by mRNA and protein degradation, until the basal gene expression level is reached. Reversibility of an inducible system is advantageous where transient expression of a target protein is desirable. Reversibility allows temporal control in assays, where the target protein can be turned ON and OFF as per requirement.
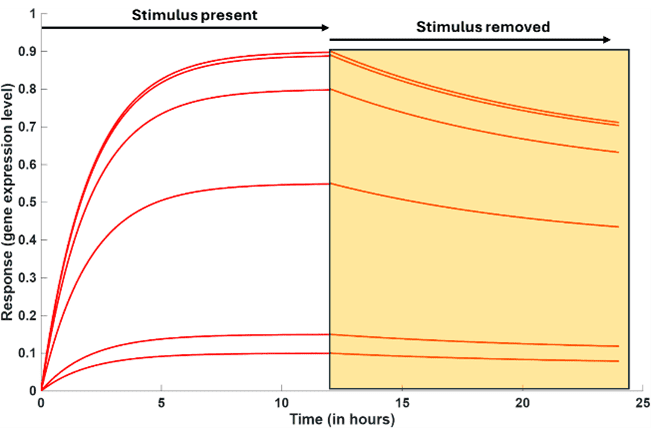
Figure 11c. Reversibility of gene expression to basal level in the absence of stimulus.
There are two aspects of orthogonality:
In the case of dual-inducible system, where two different genes are activated by two separate chemical inducers, it is desirable that the two-induction pathway doesn’t affect each other (Figure 12). This is to make sure that various combinations of expression levels for the two genes can be achieved in the same cell without affecting each other. Orthogonality is a desirable feature for designing complex gene regulation circuits using known components, like logic gates and minimal computational operators. Therefore, orthogonality is important for reducing host cell toxicity, engineering modular designs and scalability of the design components.
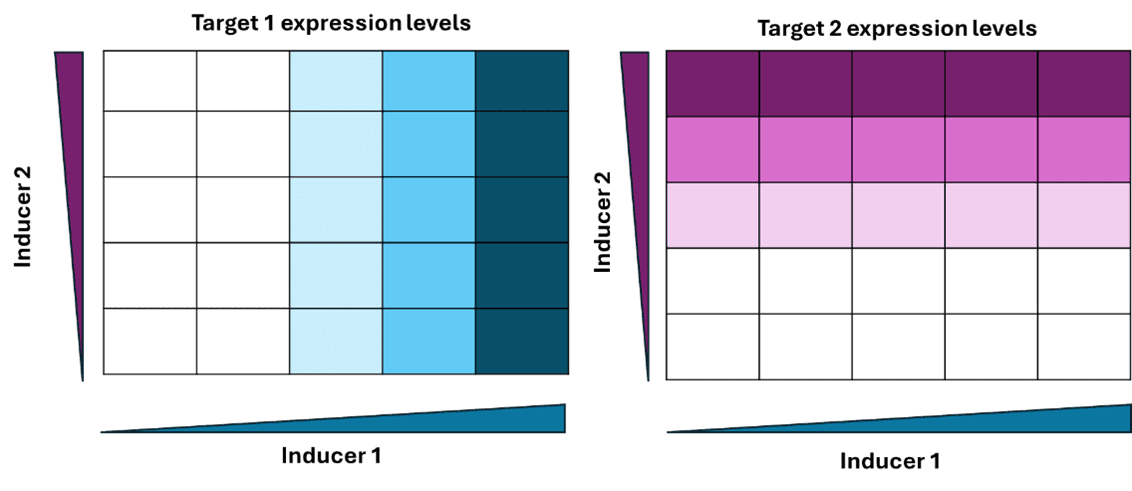
Figure 12. Orthogonality in gene expression in a dual inducible system. Target1 is specifically induced by Inducer1 and Target2 is specifically induced by Inducer 2 even in the presence of maximum concentration of both the inducers (stimulus).
The level of ectopic gene expression in a cell is known to reduce over generations of cell passages. This is since any transgene expression is a metabolic burden for cell growth and in a population, cells expressing transgenes can be surpassed by the cells that managed to shut down expression or completely removed the transgene. As a result, the responsiveness of an inducible system can reduce over multiple cell passages, and it is important to know if the cells are inducible to the same extent when cultured for a long period of time. The consistency of an inducible system to respond to a stimulus to the same extent even after multiple passages is called responsive stability.
Variability in gene expression and eventual shut down of the synthetic inducible system integrated in the genome in a sub-population can affect the stability of the inducible system over multiple generations of cell passage. Therefore, it is important to build an inducible system, that can be activated robustly every time a clonal population of cells is passaged for a long period of time or are revived from cryo-storage and used in an assay. Epigenetic silencing due to DNA methylation or histone modification is a major reason for reducing responsive stability. There are few ways to evade epigenetic silencing:
1) Inducible gene expression cassettes are linked to essential genes, like the ones that provide antibiotic resistance, and the cells are grown in growth media with the respective antibiotics, forcing the cells to keep the genomic locus active.
2) use of insulator DNA sequences flanking the inducible gene cassette.
3) targeted integration of the gene cassette in genomic safe-harbor sites
4) Integration of multiple copies of the gene cassette in euchromatins to ensure continuous expression, even when some copies are shut down.
RoukenBio’s LocIn system incorporates the design strategies discussed above and provides the ideal platform for preserving the responsive stability of the inducible gene expression system.
IndEx2 is being optimised based on the performance metrics discussed above. It is a chemically-induced-proximity system that relies on a two-component transcription factor-based gene activation and is specifically designed for inducible expression of one or two target antigens of interest with a large dynamic range, tunability and robust implementation in multiple host cells that are clinically relevant and compatible with immune-cell bioassays. The portability of IndEx2 across cell lines allows use of blank cells (host cells without IndEx2 platform) as true negative controls for target antigen expression-based assays. The various applications of IndEx2 are:
Evaluating activation threshold of drug candidates like T-cell engagers.
🗓️ Stay informed with our monthly scientific newsletter, published on LinkedIn on the last Wednesday of each month.
These editions bring you the latest in drug development breakthroughs, industry trends, and expert insights from the brilliant minds at RoukenBio.
Subscribe today on LinkedInExplore real dual-inducible IndEx-2 data and learn more about how this system could boost your therapeutic development.