
Dr Daria Paruzina
Scientific Director of Innovation

Dr Athanasios Koulis
KTP Associate

Hannah Findlay
Senior Study Manager

 Research Posters
|
November 4, 2026
|
5 min read
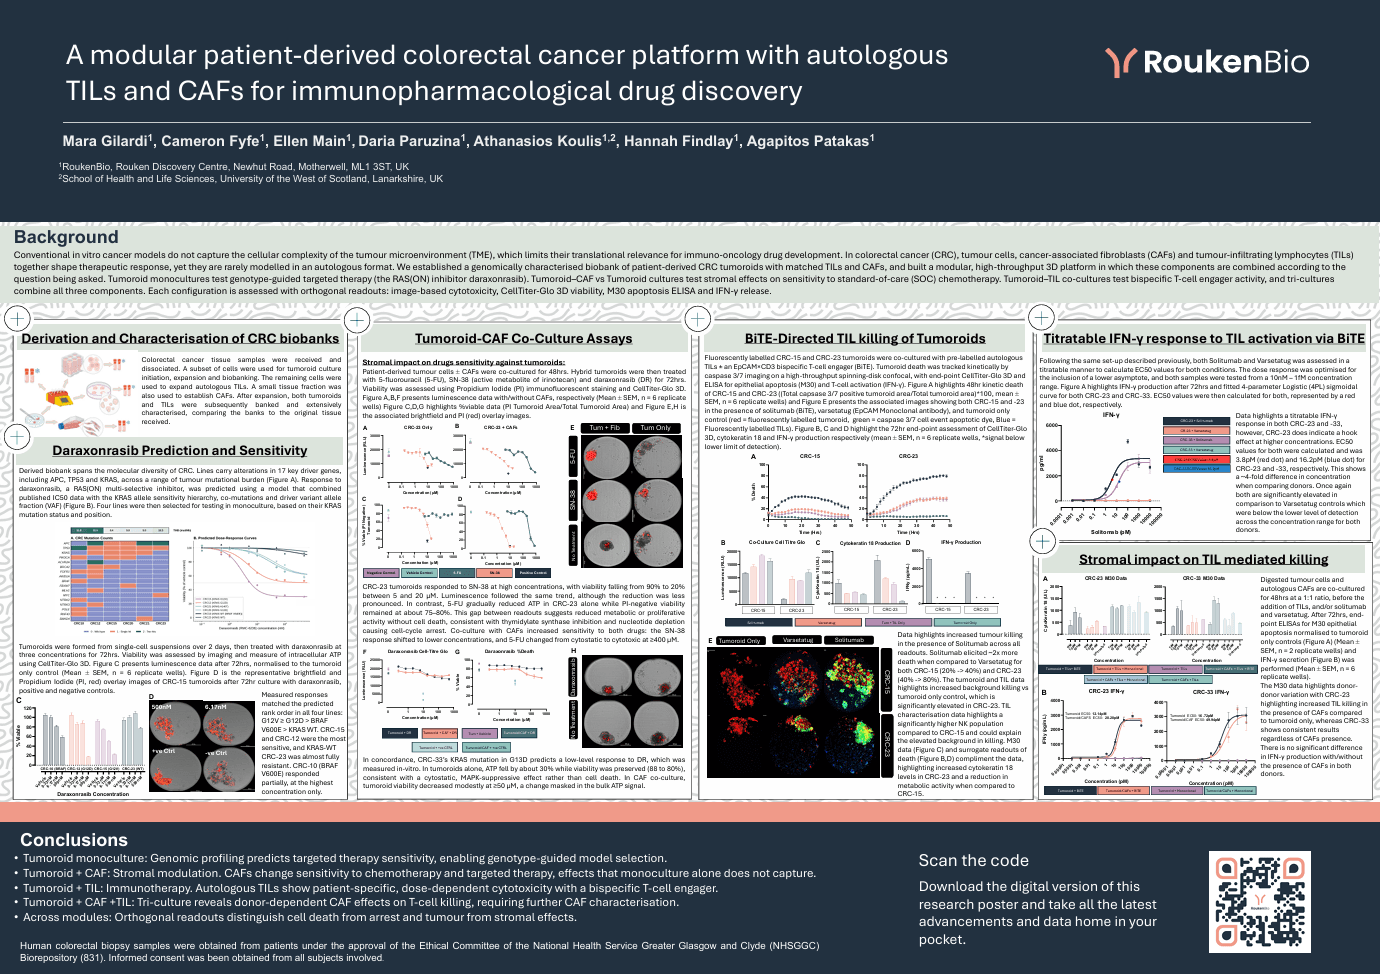
Conventional in vitro cancer models do not capture the cellular complexity of the tumour microenvironment (TME), which limits their translational relevance for immuno-oncology drug development. In colorectal cancer (CRC), tumour cells, cancer-associated fibroblasts (CAFs) and tumour-infiltrating lymphocytes (TILs) together shape therapeutic response, yet they are rarely modelled in an autologous format. We established a genomically characterised biobank of patient-derived CRC tumoroids with matched TILs and CAFs, and built a modular, high-throughput 3D platform in which these components are combined according to the question being asked. Tumoroid monocultures test genotype-guided targeted therapy (the RAS(ON) inhibitor daraxonrasib). Tumoroid–CAF vs Tumoroid cultures test stromal effects on sensitivity to standard-of-care (SOC) chemotherapy. Tumoroid–TIL co-cultures test bispecific T-cell engager activity, and tri-cultures combine all three components. Each configuration is assessed with orthogonal readouts: image-based cytotoxicity, CellTiter-Glo 3D viability, M30 apoptosis ELISA and IFN-γ release.
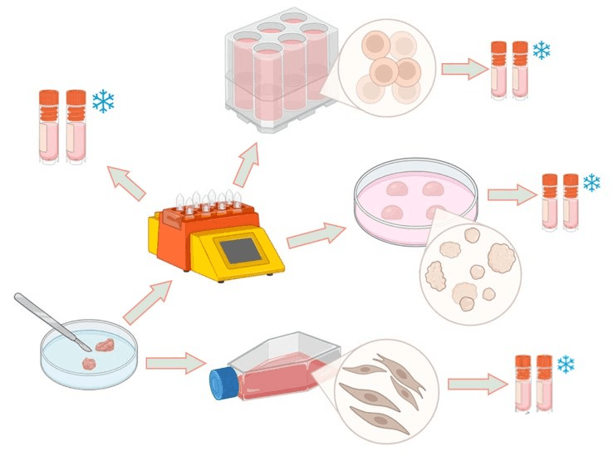
Colorectal cancer tissue samples were received and dissociated. A subset of cells were used for tumoroid culture initiation, expansion and biobanking. The remaining cells were used to expand autologous TILs. A small tissue fraction was also used to establish CAFs. After expansion, both tumoroids and TILs were subsequently banked and extensively characterised, comparing the banks to the original tissue received.
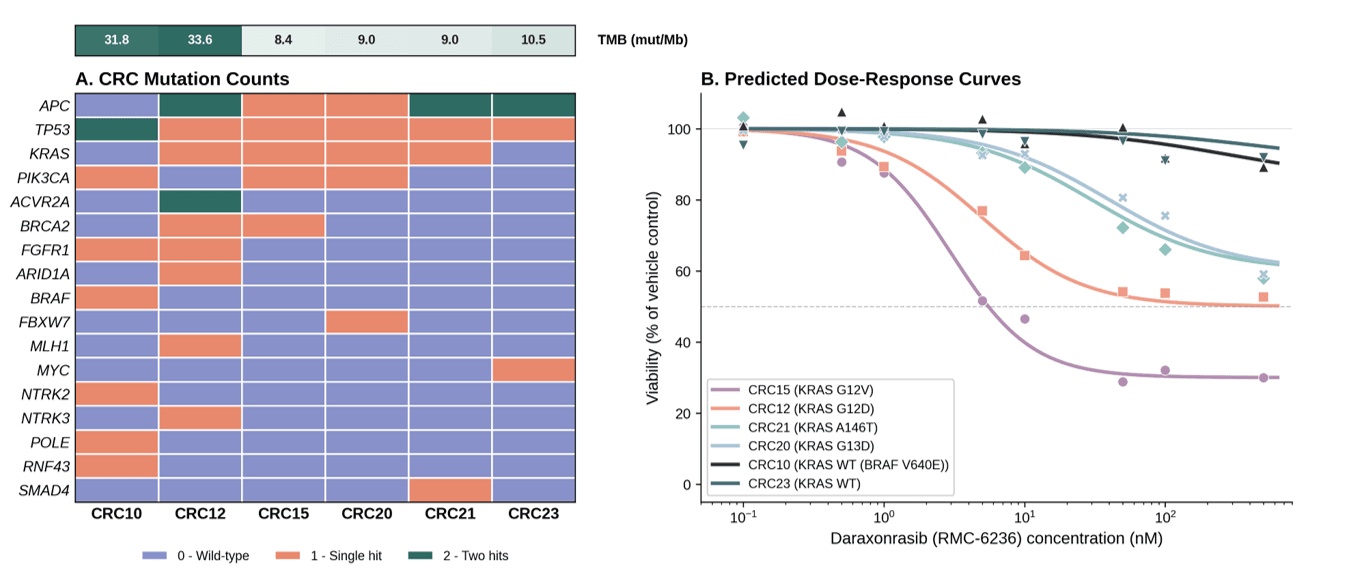
Derived biobank spans the molecular diversity of CRC. Lines carry alterations in 17 key driver genes, including APC, TP53 and KRAS, across a range of tumour mutational burden (Figure A). Response to daraxonrasib, a RAS(ON) multi-selective inhibitor, was predicted using a model that combined published IC50 data with the KRAS allele sensitivity hierarchy, co-mutations and driver variant allele fraction (VAF) (Figure B). Four lines were then selected for testing in monoculture, based on their KRAS mutation status and position.
Tumoroids were formed from single-cell suspensions over 2 days, then treated with daraxonrasib at three concentrations for 72hrs. Viability was assessed by imaging and measure of intracellular ATP using CellTiter-Glo 3D. Figure C presents luminescence data after 72hrs, normalised to the tumoroid only control (Mean ± SEM, n = 6 replicate wells). Figure D is the representative brightfield and Propidium Iodide (PI, red) overlay images of CRC-15 tumoroids after 72hr culture with daraxonrasib, positive and negative controls.
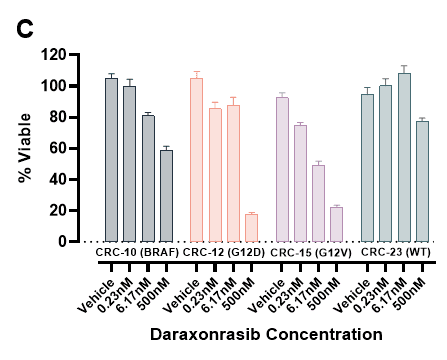
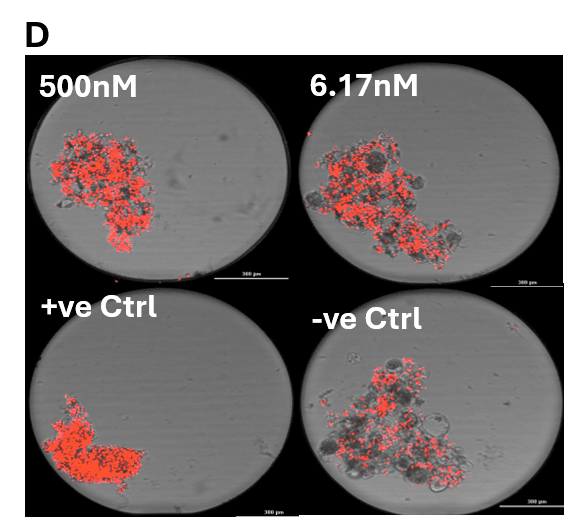
Measured responses matched the predicted rank order in all four lines: G12V ≥ G12D > BRAF V600E > KRAS WT. CRC-15 and CRC-12 were the most sensitive, and KRAS-WT CRC-23 was almost fully resistant. CRC-10 (BRAF V600E) responded partially, at the highest concentration only.
Patient-derived tumour cells ± CAFs were co-cultured for 48hrs. Hybrid tumoroids were then treated with 5-fluorouracil (5-FU), SN-38 (active metabolite of irinotecan) and daraxonrasib (DR) for 72hrs. Viability was assessed using Propidium Iodide (PI) immunofluorescent staining and CellTiter-Glo 3D. Figure A,B,F presents luminescence data with/without CAFs, respectively (Mean ± SEM, n = 6 replicate wells) Figure C,D,G highlights %viable data (PI Tumoroid Area/Total Tumoroid Area) and Figure E,H is the associated brightfield and PI (red) overlay images.
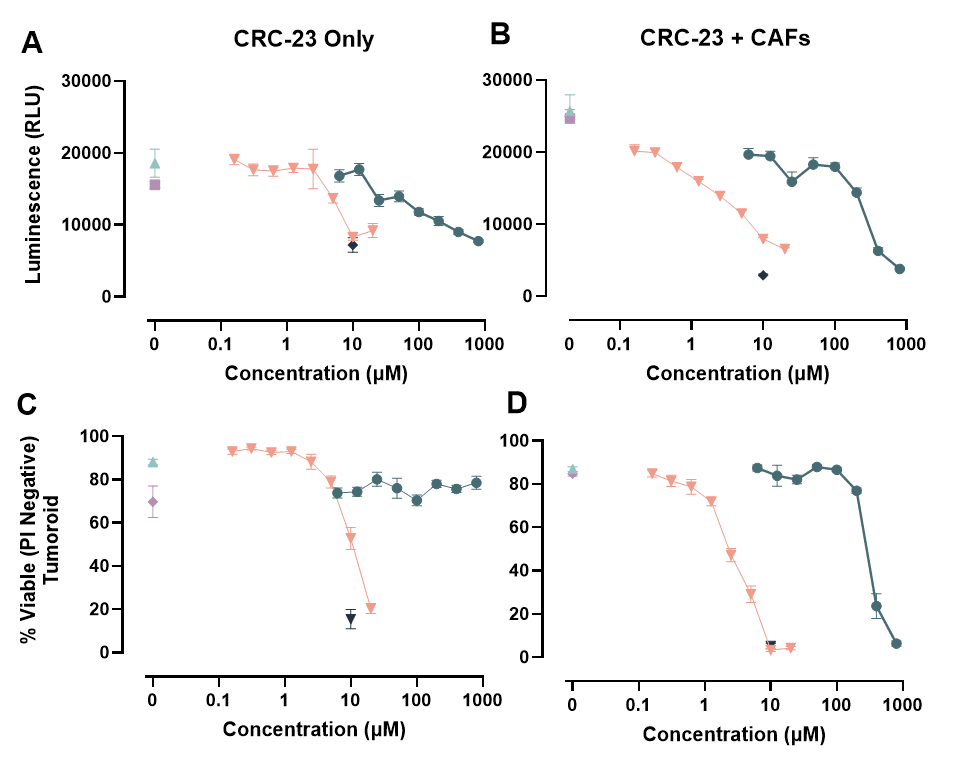

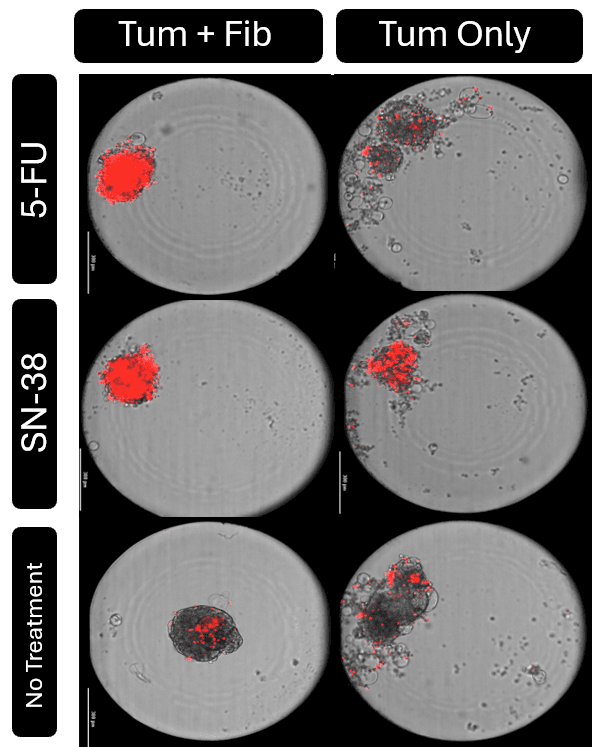
CRC-23 tumoroids responded to SN-38 at high concentrations, with viability falling from 90% to 20% between 5 and 20 µM. Luminescence followed the same trend, although the reduction was less pronounced. In contrast, 5-FU gradually reduced ATP in CRC-23 alone while PI-negative viability remained at about 75–80%. This gap between readouts suggests reduced metabolic or proliferative activity without cell death, consistent with thymidylate synthase inhibition and nucleotide depletion causing cell-cycle arrest. Co-culture with CAFs increased sensitivity to both drugs: the SN-38 response shifted to lower concentrations, and 5-FU changed from cytostatic to cytotoxic at ≥400 µM.
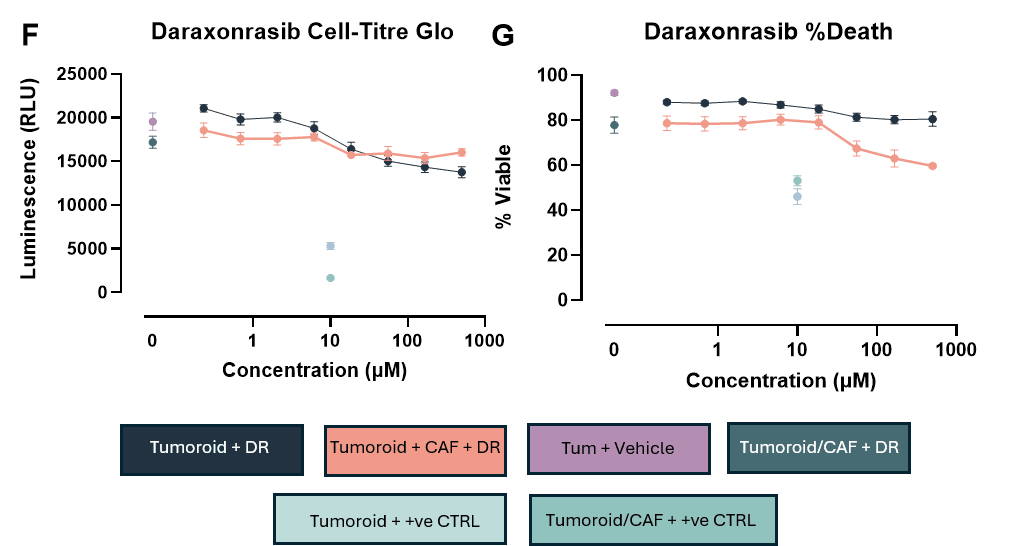
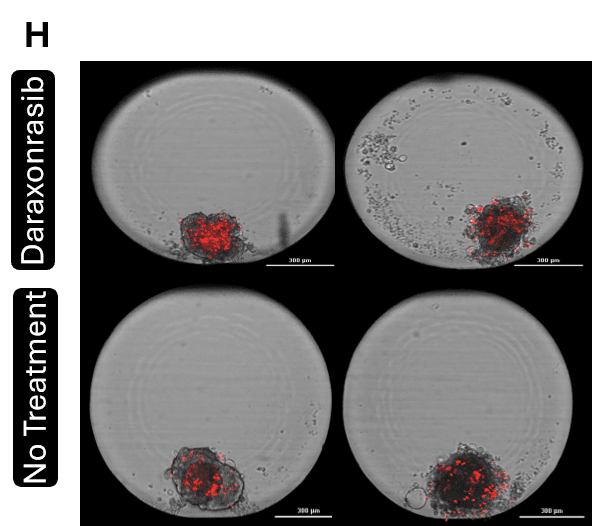
In concordance, CRC-33’s KRAS mutation in G13D predicts a low-level response to DR, which was measured in-vitro. In tumoroids alone, ATP fell by about 30% while viability was preserved (88 to 80%), consistent with a cytostatic, MAPK-suppressive effect rather than cell death. In CAF co-culture, tumoroid viability decreased modestly at ≥50 µM, a change masked in the bulk ATP signal.
Fluorescently labelled CRC-15 and CRC-23 tumoroids were co-cultured with pre-labelled autologous TILs ± an EpCAM×CD3 bispecific T-cell engager (BiTE). Tumoroid death was tracked kinetically by caspase 3/7 imaging on a high-throughput spinning-disk confocal, with end-point CellTiter-Glo 3D and ELISA for epithelial apoptosis (M30) and T-cell activation (IFN-γ). Figure A highlights 48hr kinetic death of CRC-15 and CRC-23 ((Total capsase 3/7 positive tumoroid area/Total tumoroid area)*100, mean ± SEM, n = 6 replicate wells) and Figure E presents the associated images showing both CRC-15 and -23 in the presence of solitumab (BiTE), varsetatug (EpCAM Monoclonal antibody), and tumoroid only control (red = fluorescently labelled tumoroid, green = caspase 3/7 cell event apoptotic dye, Blue = Fluorescently labelled TILs). Figure B, C and D highlight the 72hr end-point assessment of CellTiter-Glo 3D, cytokeratin 18 and IFN-γ production respectively (mean ± SEM, n = 6 replicate wells, *signal below lower limit of detection).
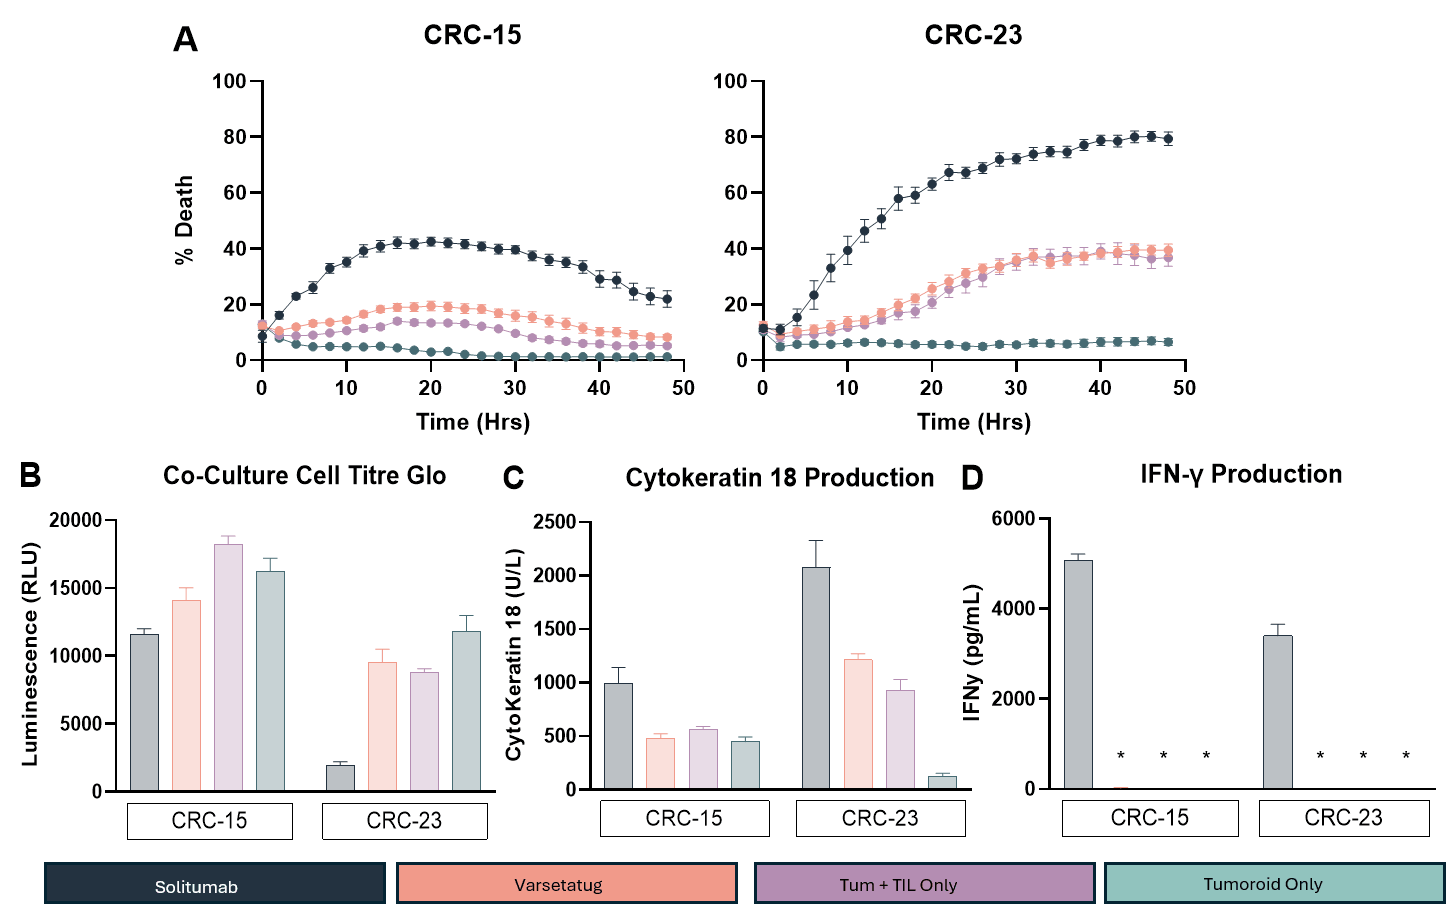
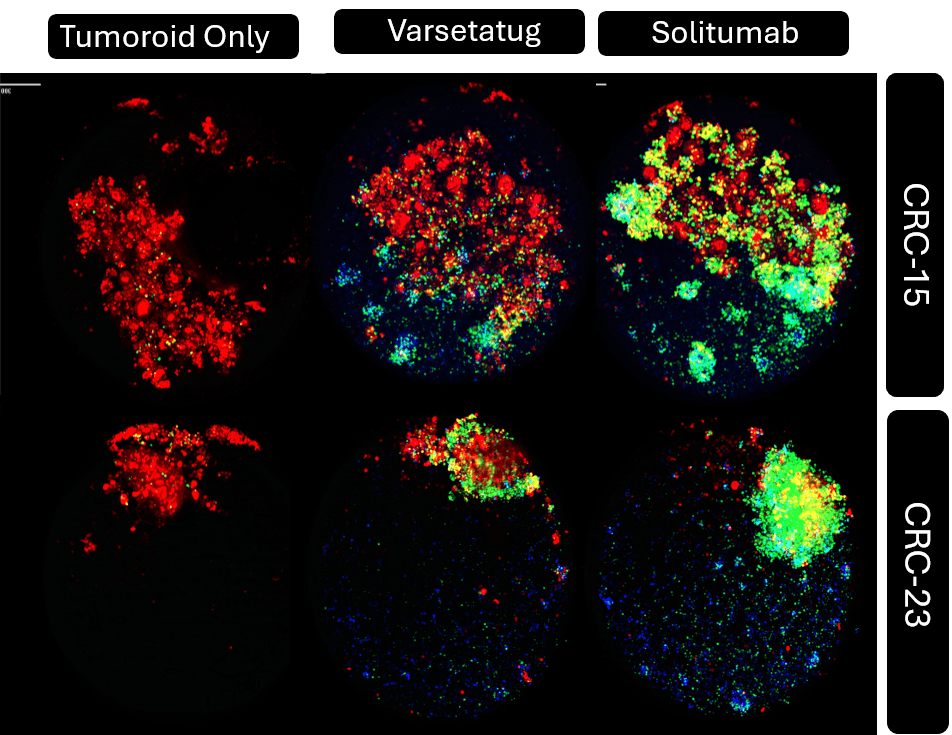
Data highlights increased tumour killing in the presence of Solitumab across all readouts. Solitumab elicited ~2x more death when compared to Varsetatug for both CRC-15 (20% -> 40%) and CRC-23 (40% -> 80%). The tumoroid and TIL data highlights increased background killing vs tumoroid only control, which is significantly elevated in CRC-23. TIL characterisation data highlights a significantly higher NK population compared to CRC-15 and could explain the elevated background in killing. M30 data (Figure C) and surrogate readouts of death (Figure B,D) compliment the data, highlighting increased cytokeratin 18 levels in CRC-23 and a reduction in metabolic activity when compared to CRC-15.
Following the same set-up described previously, both Solitumab and Varsetatug was assessed in a titratable manner to calculate EC50 values for both conditions. The dose response was optimised for the inclusion of a lower asymptote, and both samples were tested from a 10nM – 1fM concentration range. Figure A highlights IFN-γ production after 72hrs and fitted 4-parameter Logistic (4PL) sigmoidal curve for both CRC-23 and CRC-33. EC50 values were then calculated for both, represented by a red and blue dot, respectively.
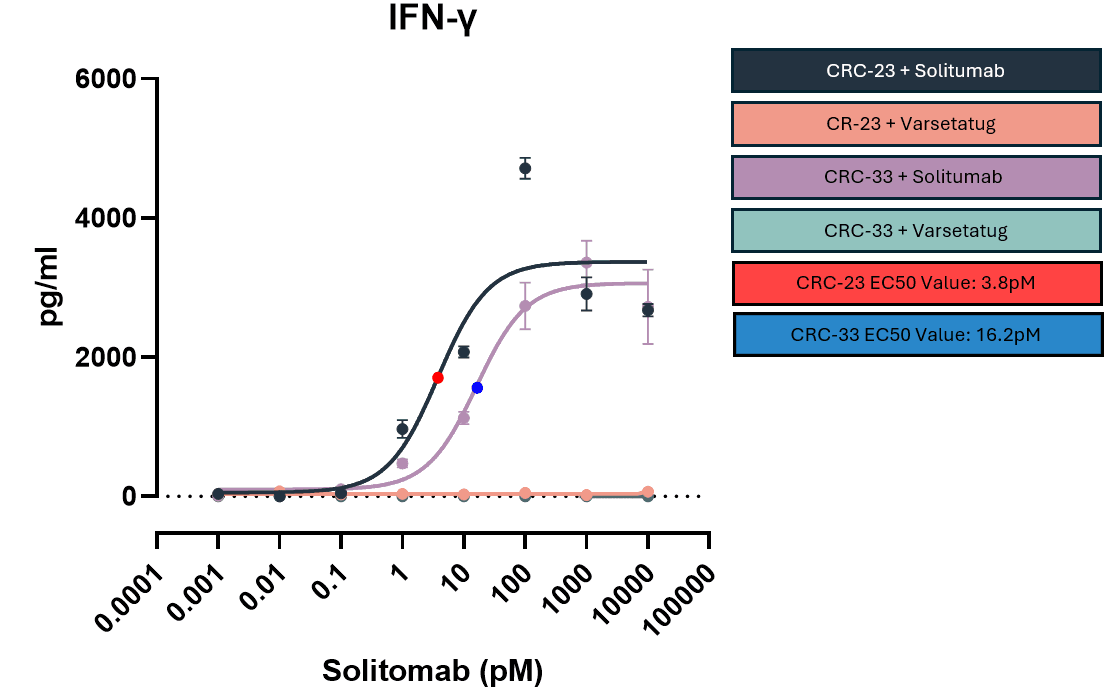
Data highlights a titratable IFN-γ response in both CRC-23 and -33, however, CRC-23 does indicate a hook effect at higher concentrations. EC50 values for both were calculated and was 3.8pM (red dot) and 16.2pM (blue dot) for CRC-23 and -33, respectively. This shows a ~4-fold difference in concentration when comparing donors. Once again both are significantly elevated in comparison to Varsetatug controls which were below the lower level of detection across the concentration range for both donors.
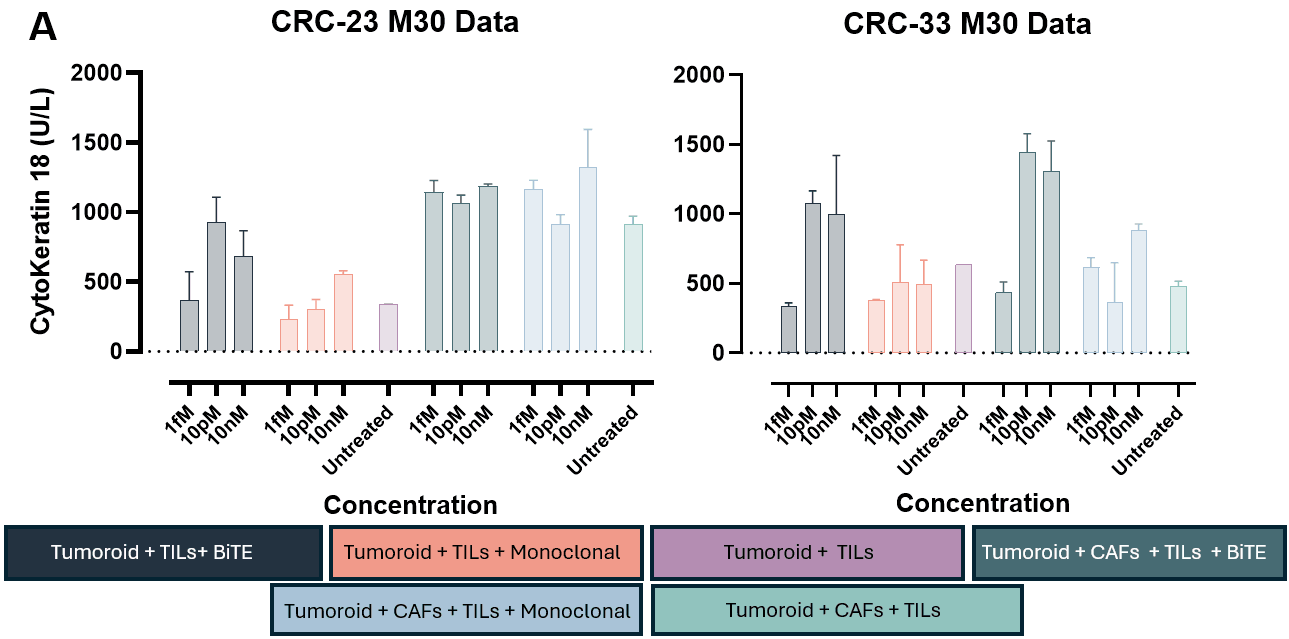
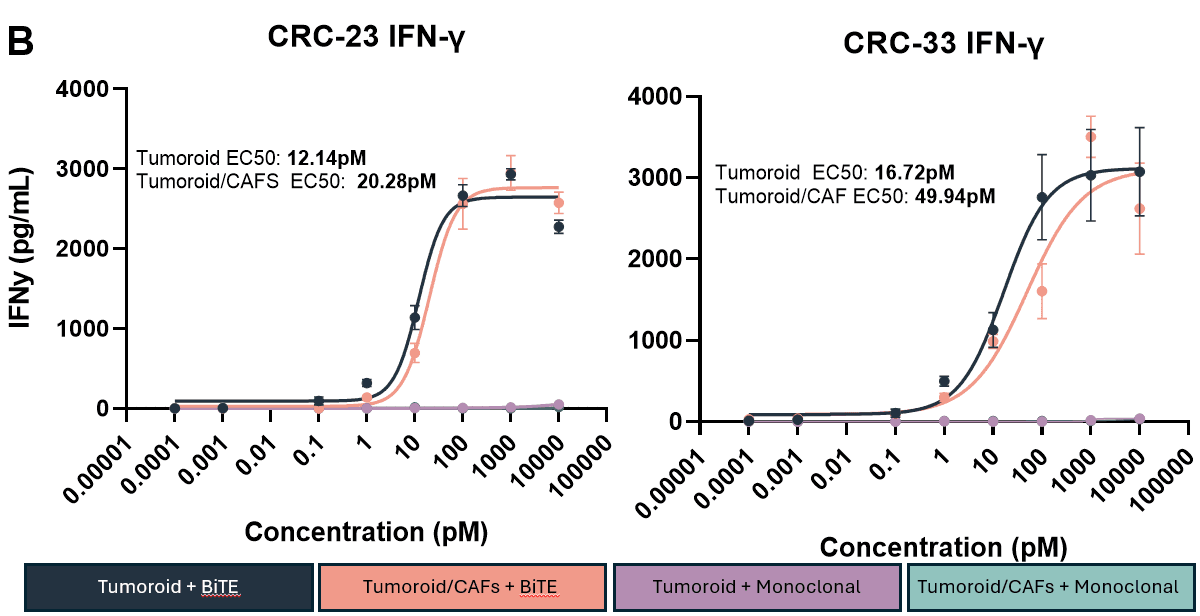
Digested tumour cells and autologous CAFs are co-cultured for 48hrs at a 1:1 ratio, before the addition of TILs, and/or solitumab and varsetatug. After 72hrs, end-point ELISAs for M30 epithelial apoptosis normalised to tumoroid only controls (Figure A) (Mean ± SEM, n = 2 replicate wells) and IFN-γ secretion (Figure B) was performed (Mean ± SEM, n = 6 replicate wells).
The M30 data highlights donor-donor variation with CRC-23 highlighting increased TIL killing in the presence of CAFs compared to tumoroid only, whereas CRC-33 shows consistent results regardless of CAFs presence. There is no significant difference in IFN-γ production with/without the presence of CAFs in both donors.
Human colorectal biopsy samples were obtained from patients under the approval of the Ethical Committee of the National Health Service Greater Glasgow and Clyde (NHSGGC) Biorepository (831). Informed consent was been obtained from all subjects involved.
Explore our capabilities across advanced in vitro and ex vivo models and discover how RoukenBio can help progress your drug discovery programme.


🗓️ Stay informed with our monthly scientific newsletter, published on LinkedIn on the last Wednesday of each month.
These editions bring you the latest in drug development breakthroughs, industry trends, and expert insights from the brilliant minds at RoukenBio.
Subscribe today on LinkedIn